Fibonacci Calculator
Fibonacci analysis – Fibonacci analysis is used by traders to predict how far price might retrace a given move to determine support and resistance levels in a asset. By looking at the prior highs and lows of the previous move. Traders use Fib’s retracements to determine how far a current retracement might last.
Who is Fibonacci?
Leonardo Pisano, better known by his nickname Fibonacci (1170-1240), is considered to be the most talented Western mathematician of the Middle Ages. While working on a problem involving the population growth of rabbits, he discovered Fibonacci sequence numbers – something which Fibonacci is most renowned for today.
What are Fibonacci Sequence Numbers?
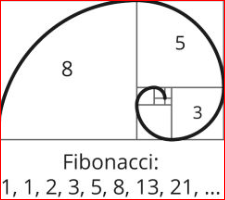
The Fibonacci sequence is one of the most famous formulas in mathematics.

Fibonacci discovered that there was a relationship with adding numbers together and then the dividing relationship came up with repetitive percentage figures. This is called the Fibonacci summation or “series” numbers.
Each number in the sequence is the sum of the two numbers that precede it. So, the sequence goes: 0, 1, 1, 2, 3, 5, 8, 13, 21, 34, and so on. If you take 1 + 2 you get 3, then if you take 2+ 3 you get 5, and if you take 3 + 5 you get 8 and so on. This creates an infinite series of numbers that adds each number to the previous. An example is 1,2,3, 5,8,13,21,34,55,89,144, 233, 377, 610, 987 and so on.
Fibonacci ratios are numbers derived from the calculations within the Fibonacci series numbers. The most common numbers are .382%, .50%, .618%, .786%, 1.00%, 1.272% and 1.618%. Found within the Fibonacci sequence is the Golden Ratio, or roughly 1.618. If you divide a number of the sequence by the preceding number, the resulting ratio will be approximately 1.618. (55/34 = 1.618)
The “Golden Ratio” number is often referred to for the number .618% due to the many coincidences that reoccurs with that number. For example, 89=+/- .618 of 144, 144 divided by 233 + .618, .382 + .618 = 1.00, .786 = the square root of .618%.
Fibonacci Retracement aka Correction – Fibonacci retracement levels are a component of technical analysis that can assist traders in trading with and analyzing market trends and channels. When used to help identify pullbacks and price reversals, Fibonacci Retracements rely on calculated levels to provide insight when a market makes a move from a low to a high, price will have a tendency to pullback, retrace or correct. The percentage of the pullback can be .382%, .50%, .618%, .786% and at times even 100%. The ratios form the basis determines the size of the retracement. 38.2% is considered shallow and 62.8% is considered deeper, while a 50% retracement is considered medium. These three levels or zones serve as alerts for the trader to watch for possible areas of price resuming its previous trend.
Fibonacci extensions – There are times when a pullback can retrace beyond the original starting point and exceed 100 percent of the initial wave or trend. So a Fibonacci extension is essentially a correction that exceeds the low of the initial trend. Technicians will use the 100 percent, 1.272 percent and 1.618 percent ratios to target a pullback level. This state of correction can be considered a double bottom at the 100 percent pullback level, and when we see that correction exceed the low point. By using the extension tool, you have a great place to place your stops and keep them out of harm’s way by using the “hidden” or invisible support level as determined by the Fibonacci extension technique.